It sounds so simple: you set up the EEG headset and then start to measure a number of emotions and motivations. However, to translate raw brain data to clear insights demands quite the analysis. In this blog, we will address the EEG data-analysis.
EEG data can be analyzed in two different ways. One way is quantitative analysis, where the means of the group are used. Another way is qualitative analysis, where specific strengths and weaknesses of an advertisement, website, or shop are highlighted. How do this analyses work?Basic principles of the analysis
Our portable EEG headset not only enables advertisement and website research in our living room lab in Utrecht, but also at location in a shop. After conducting the research, we start the analysis where we pave the way through the subconscious brain of the participants.
We analyze the EEG data in two different ways, which we will further discuss in this blog:
- The quantitative analysis is carried out for advertisement research and retail research. For these analyses, we aggregate the data of all participants and draw conclusions for the advertisement or shop in its entirety. Quantitative research is aimed at predicting success or to select the most effective option from a set of alternatives. For example: which shelf arrangement evokes the most desire?
- The qualitative analysis is performed for advertisement research, retail research, and usability research. For each participant, we check each second of the research to see how their emotions and motivations fluctuate over time. That way, we can give specific recommendations per subject.
For these two analyses we use four different EEG-metrics:
- Desire
- Distraction
- Attention
- Workload
(For an explanation about the different metrics, read our blog: Which EEG-metrics do we use when analyzing brain activity in neuromarketing research?)
Advertisement Research
QUANTITATIVE ANALYSIS
How well will my advertisement perform within a standard advertising block on tv? Will people buy more Vanish Gold after seeing a 30 second stain challenge in an advertisement? Will my product be remembered next year? Questions like this can be answered using the quantitative brain data in advertisement research.
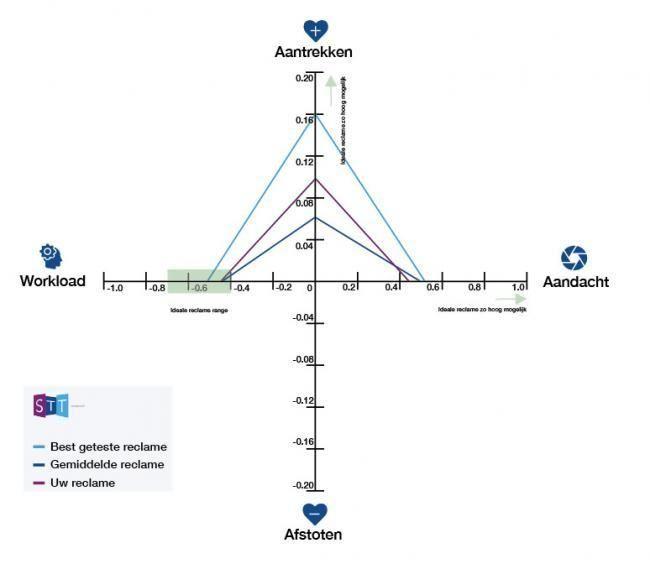
We compare the mean score of the researched advertisement with the mean score of several standard tv advertisements on three levels: Desire (Attract vs. Avoid), Workload, and Attention.
The ideal workload of an advertisement is within a range of 0.4 to 0.7. Beneath these levels, the advertisement is too boring; above these levels, it is too complicated. Attention and Desire should both be as high as possible, to be able to lead to high memorability and more sales.

QUALITATIVE ANALYSIS
As opposed to our quantitative analysis of advertisement research, we deliver our recommendations in qualitative analysis per scene. This way, we can check precisely whether the moment where the stain is removed has the desired brain effect the makers tried to accomplish.
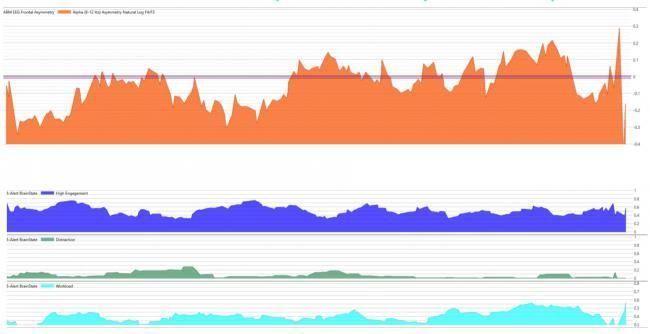
In this image, you can see an example of the brain data we analyzed for an advertisement. Here, the orange graph represents Desire (with a zero line to distinguish attraction and avoidance), the dark blue graph respresents Attention, the green graph represents Distraction, and the light blue graph represents the participants’ Workload.

Based on this brain data, we are able to give our clients recommendations on moving current video material, adding new video material, deleting current video material, and adjusting current video material. Additionally, we let the client know which frames outperform the other shots in the advertisement, so they know which ones to include in a tag-on commercial or shortened versions for other advertisement media.
Start With Eye Tracking
Contact us now!
Retail Research
QUANTITATIVE ANALYSIS
With the quantitative analysis of retail research or store research, we measure the performance of several areas in the store. These variables are especially interesting:
- The mean time spent per area
- The average Workload (measured complexity in the brain) per area
- The average Desire (measured positive emotion in the brain) per area
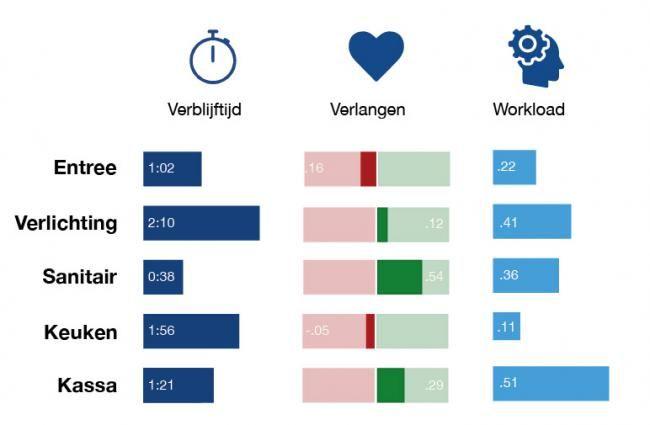
With this data, it is possible to create a “brain map” of a store, where we indicate per area how well it performs and where possible improvements can be made.
This is an example of a possible brain map, where each row represents a specific area in a store. 
QUALITATIVE ANALYSIS
When I walk into a store, I usually start exploring the first products at the entrance. Then, I continue walking to products that grasp my attention a little further away. Next, I walk back because I’m hesitating whether or not to buy the product – I just received my salary, so why wouldn’t I?
I’m guessing you’re not really interested in my shop experiences. However, this is an example of how every customer has their own route through a store. That’s why, in qualitative analyses of retail research, we analyze the data on an individual level. We follow the whole shopping trip of the participants, looking for practical improvements for the store.
Here, we look for recurring effects between participants and include all metrics to give the store several practical recommendations. Examples are recommendations on the isles, the signing, and the check-out experience.

Usability Research
QUALITATIVE ANALYSIS
Usability research can be a full-time job on its own. For this type of research, we only use our qualitative analysis where we track the entire website visit of each participant.
Basically, this is the same as retail research: Each website visitor chooses their own path, based on their interests. That’s why we use an analysis on an individual level. We focus on Desire, Workload, and Distraction amongst the participants.
Practical recommendation we give our clients may be focused on the home page, which oftenly induces a high level of Distraction and Workload. This may be detrimental to the future relationship the website has with its visitors. Additionally, many improvements in comparing products or services or checking out are possible.

Concluding Remarks
For each question we receive by a client, we use a different combination of analyses and metrics.
The analysis of brain activity is always combined with the analysis of participants’ viewing patterns, which we gained using eye-tracking. Furthermore, we often use interviews to gain a deeper understanding in the brain data.
If you’re interested in the details of a neuromarketing research procedure or analysis, don’t hesitate to contact us.


