Lorem ipsum dolor sit amet, consetetur sadip scing elitr, sed diam nonumy eirmod tempor invidunt ut labore et dolore magna aliquyam erat, sed diam voluptua. At vero eos et accusam et justo duo dolores.
The latest marketing science is clear: brands grow by being easier to think of in more buying situations. These situations, also called Category Entry Points (CEPs), are the cues that spark consumer decisions: “I’m stressed,” “It’s game day,” “We’re out of groceries.”
What sets leading brands apart is how many of these mental hooks they’ve established in the minds of consumers. The more hooks your brand has, the more likely it is to be recalled – and bought – when it counts.
CEPs are the thoughts, emotions, and contexts that reel your brand into memory at the right moment. Think:
Gatorade for after a workout
Ben & Jerry’s for late-night cravings
Tylenol for a pounding headache
Unravel Research helps you identify, measure, and strengthen these mental hooks, so your brand jumps top of mind when and where buying decisions happen.
This approach is grounded in the work of marketing scientist Byron Sharp and the Ehrenberg-Bass Institute, as described in the landmark book How Brands Grow.
It’s not about what people think of your brand – but when
Consumers don’t walk around thinking about brands all day. But when the right moment hits (a craving, a problem, a social setting) the brands that come to mind first have the advantage.
Mental availibility is about being top-of-mind in the right situations.
Category Entry Points help you understand those situations and measures how strongly your brand hooks into them.
Consultancy on CEP Development
Measuring CEPs is just the start. The real potential for brand growth lies in what you do next.
At Unravel Research, we don’t just hand over numbers but we help you translate insights into action. Once we identify which entry points your brand owns (and which it doesn’t), our consultants work with you to:
Prioritize high-impact CEPs for growth
Strengthen weak associations with targeted messaging
Align your creative, media, and packaging to key buying moments
Spot white-space opportunities your competitors are missing
Backed by expertise in consumer psychology and neuromarketing, we help brands build lasting mental availability by hooking into the moments that matter most for your brand.
Our CEP research combines marketing science with behavioral insights to map how – and when – your brand enters the minds of consumers.
Step 1: CEP Pilot- Discover the Right Entry Points
Every category has its own set of mental entry points: the moments, needs, emotions, and contexts that spark buying behavior.
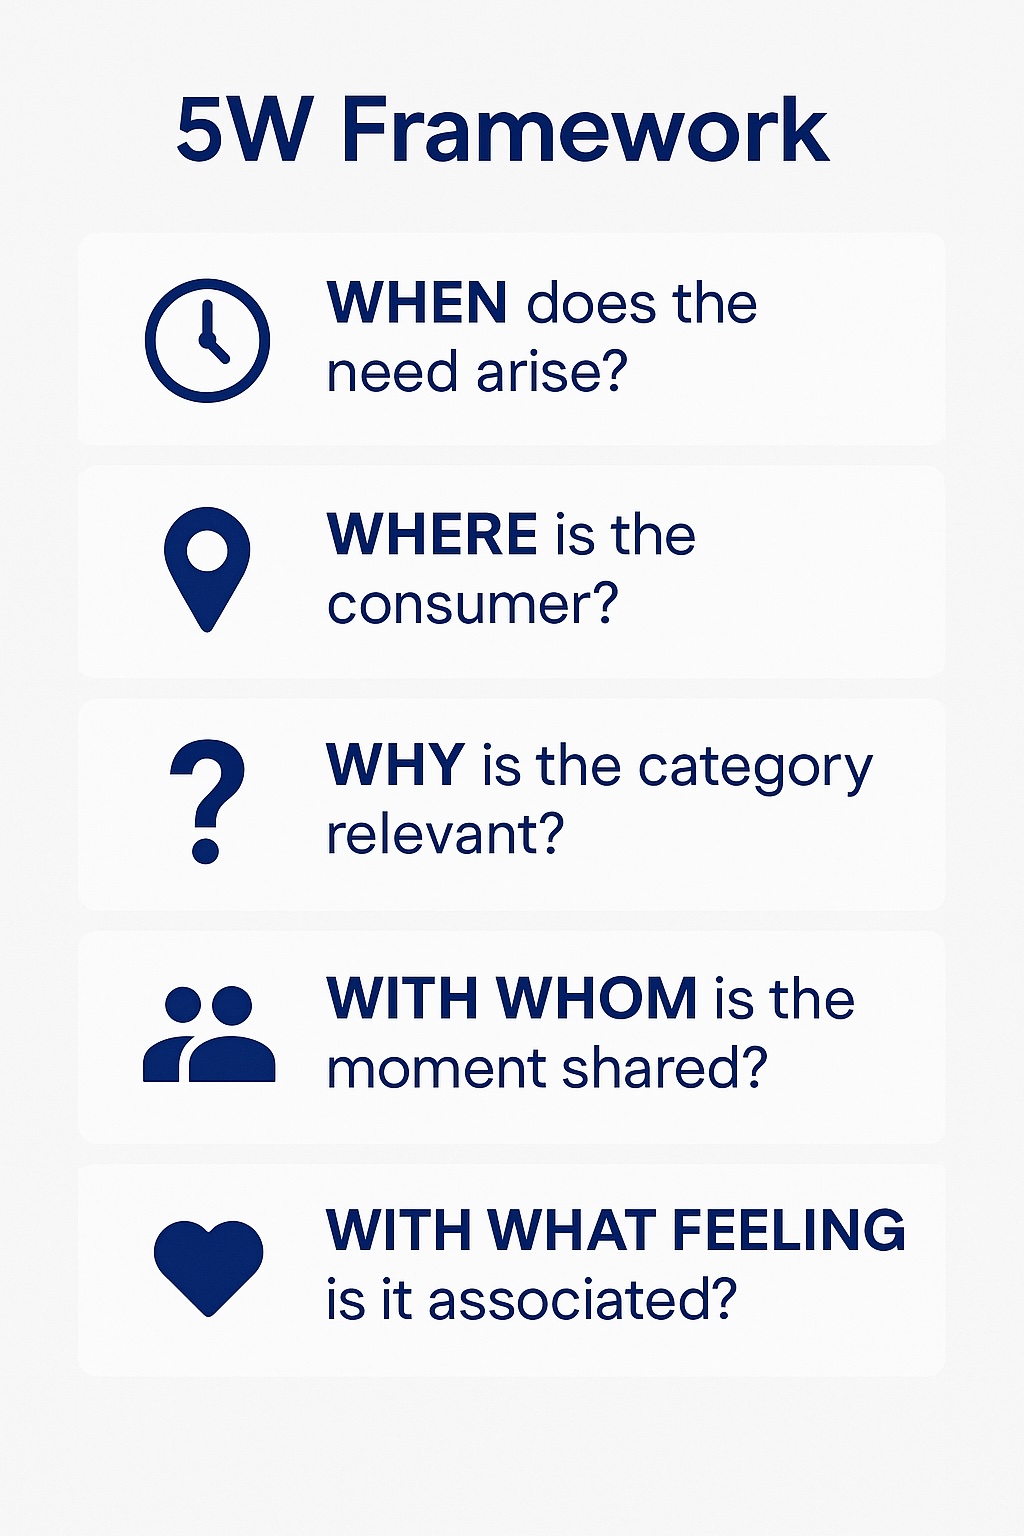
We start with a one-off pilot study to uncover the most relevant CEPs in your category, using the 5W framework:
When does the need arise?
Where is the consumer?
Why is the category relevant?
With whom is the moment shared?
With what feeling is it associated?
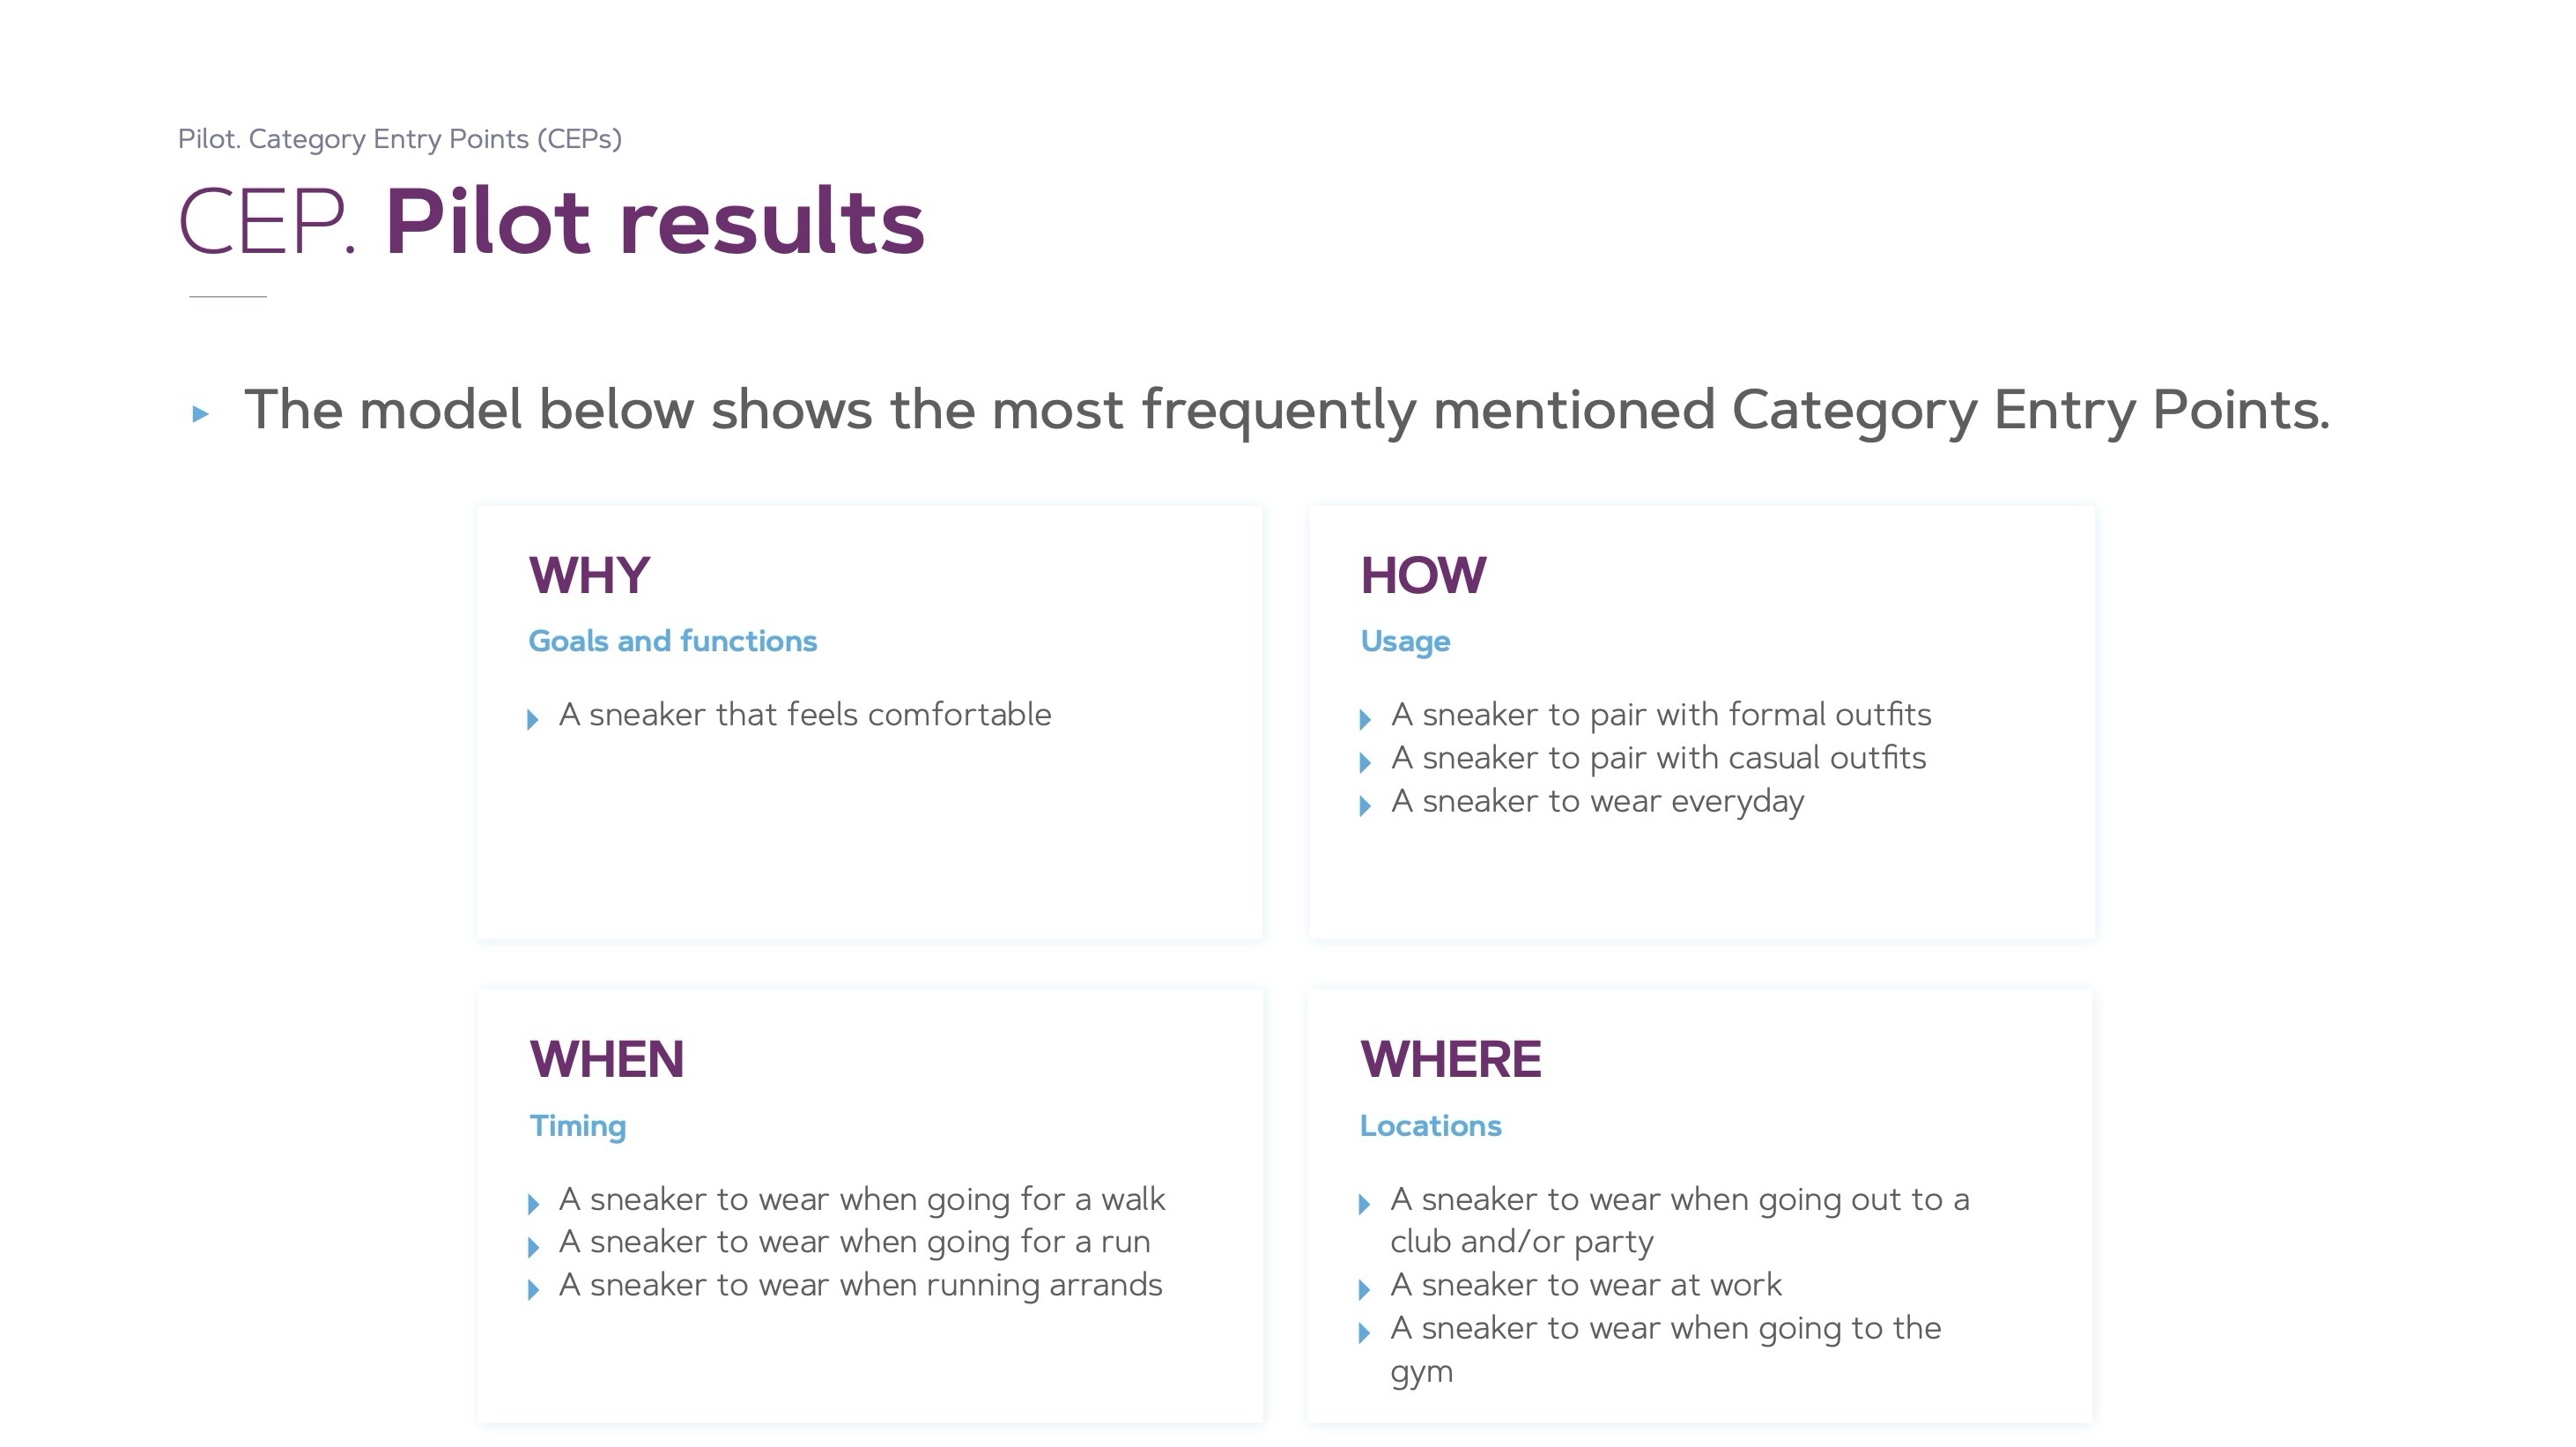
This step identifies which Category Entry Points matter most and lays the foundation for long-term mental availability growth.
Step 2: Ongoing CEP Monitoring
Once your CEP landscape is mapped, we monitor how well your brand and its competitors are mentally linked to each entry point. Most clients opt for annual tracking to monitor progress and optimize strategy.
We measure performance on three scientifically validated metrics:
Mental Market Share- how often your brand is recalled across all category entry points
Network Size- how many distinct CEPs your brand is linked to
Mental Penetration- how many consumers associate your brand with any relevant CEP
These metrics are powerful predictors of future brand growth. The bigger your mental footprint across buying situations, the more likely you are to grow.
Scalable, Reliable & Insight-Driven
The methodology is conducted via a structured, online quantitative survey. Fast, scalable, and cost-efficient. Ideal for both one-off insights and continuous tracking.
Unravel delivers not just data, but strategic recommendations:
✔ Which CEPs to defend ✔ Which to grow ✔ Which to claim before your competitors do
Unravel Research has extensively optimized and automated data collection and analysis. This allows us to offer unparalleled 5-day project lead times for CEP research in the market.
Day 1: Kick-off
During the kick-off audit, we discuss the CEP's that should be included in the test. In case this is the first CEP test for your brand, we highly recommend to start with an exploratory pilot first to select the most important CEP's for your category.
Day 2-4: Fieldwork
Respondent recruitment and data collection. We recommend 150 respondents for each cell.
Day 5: Data Analysis & Report
We analyze each CEP's performance and brand linkage. The insights will be clearly presented in the final report, including actionable recommendations on how to go forward for maximal brand growth.
Our fieldwork runs in Qualtrics and can be integrated with other research modules, either offered by Unravel or your own. Category Entry Point (CEP) measurement is often combined with the following modules:
Brand Awareness metrics
Brand Image
Brand Asset testing
“The Neuro Research proved to be very valuable to us. We made a deliberate choice for neuromarketing research. We don't want socially accepted answers, we want real insights.”
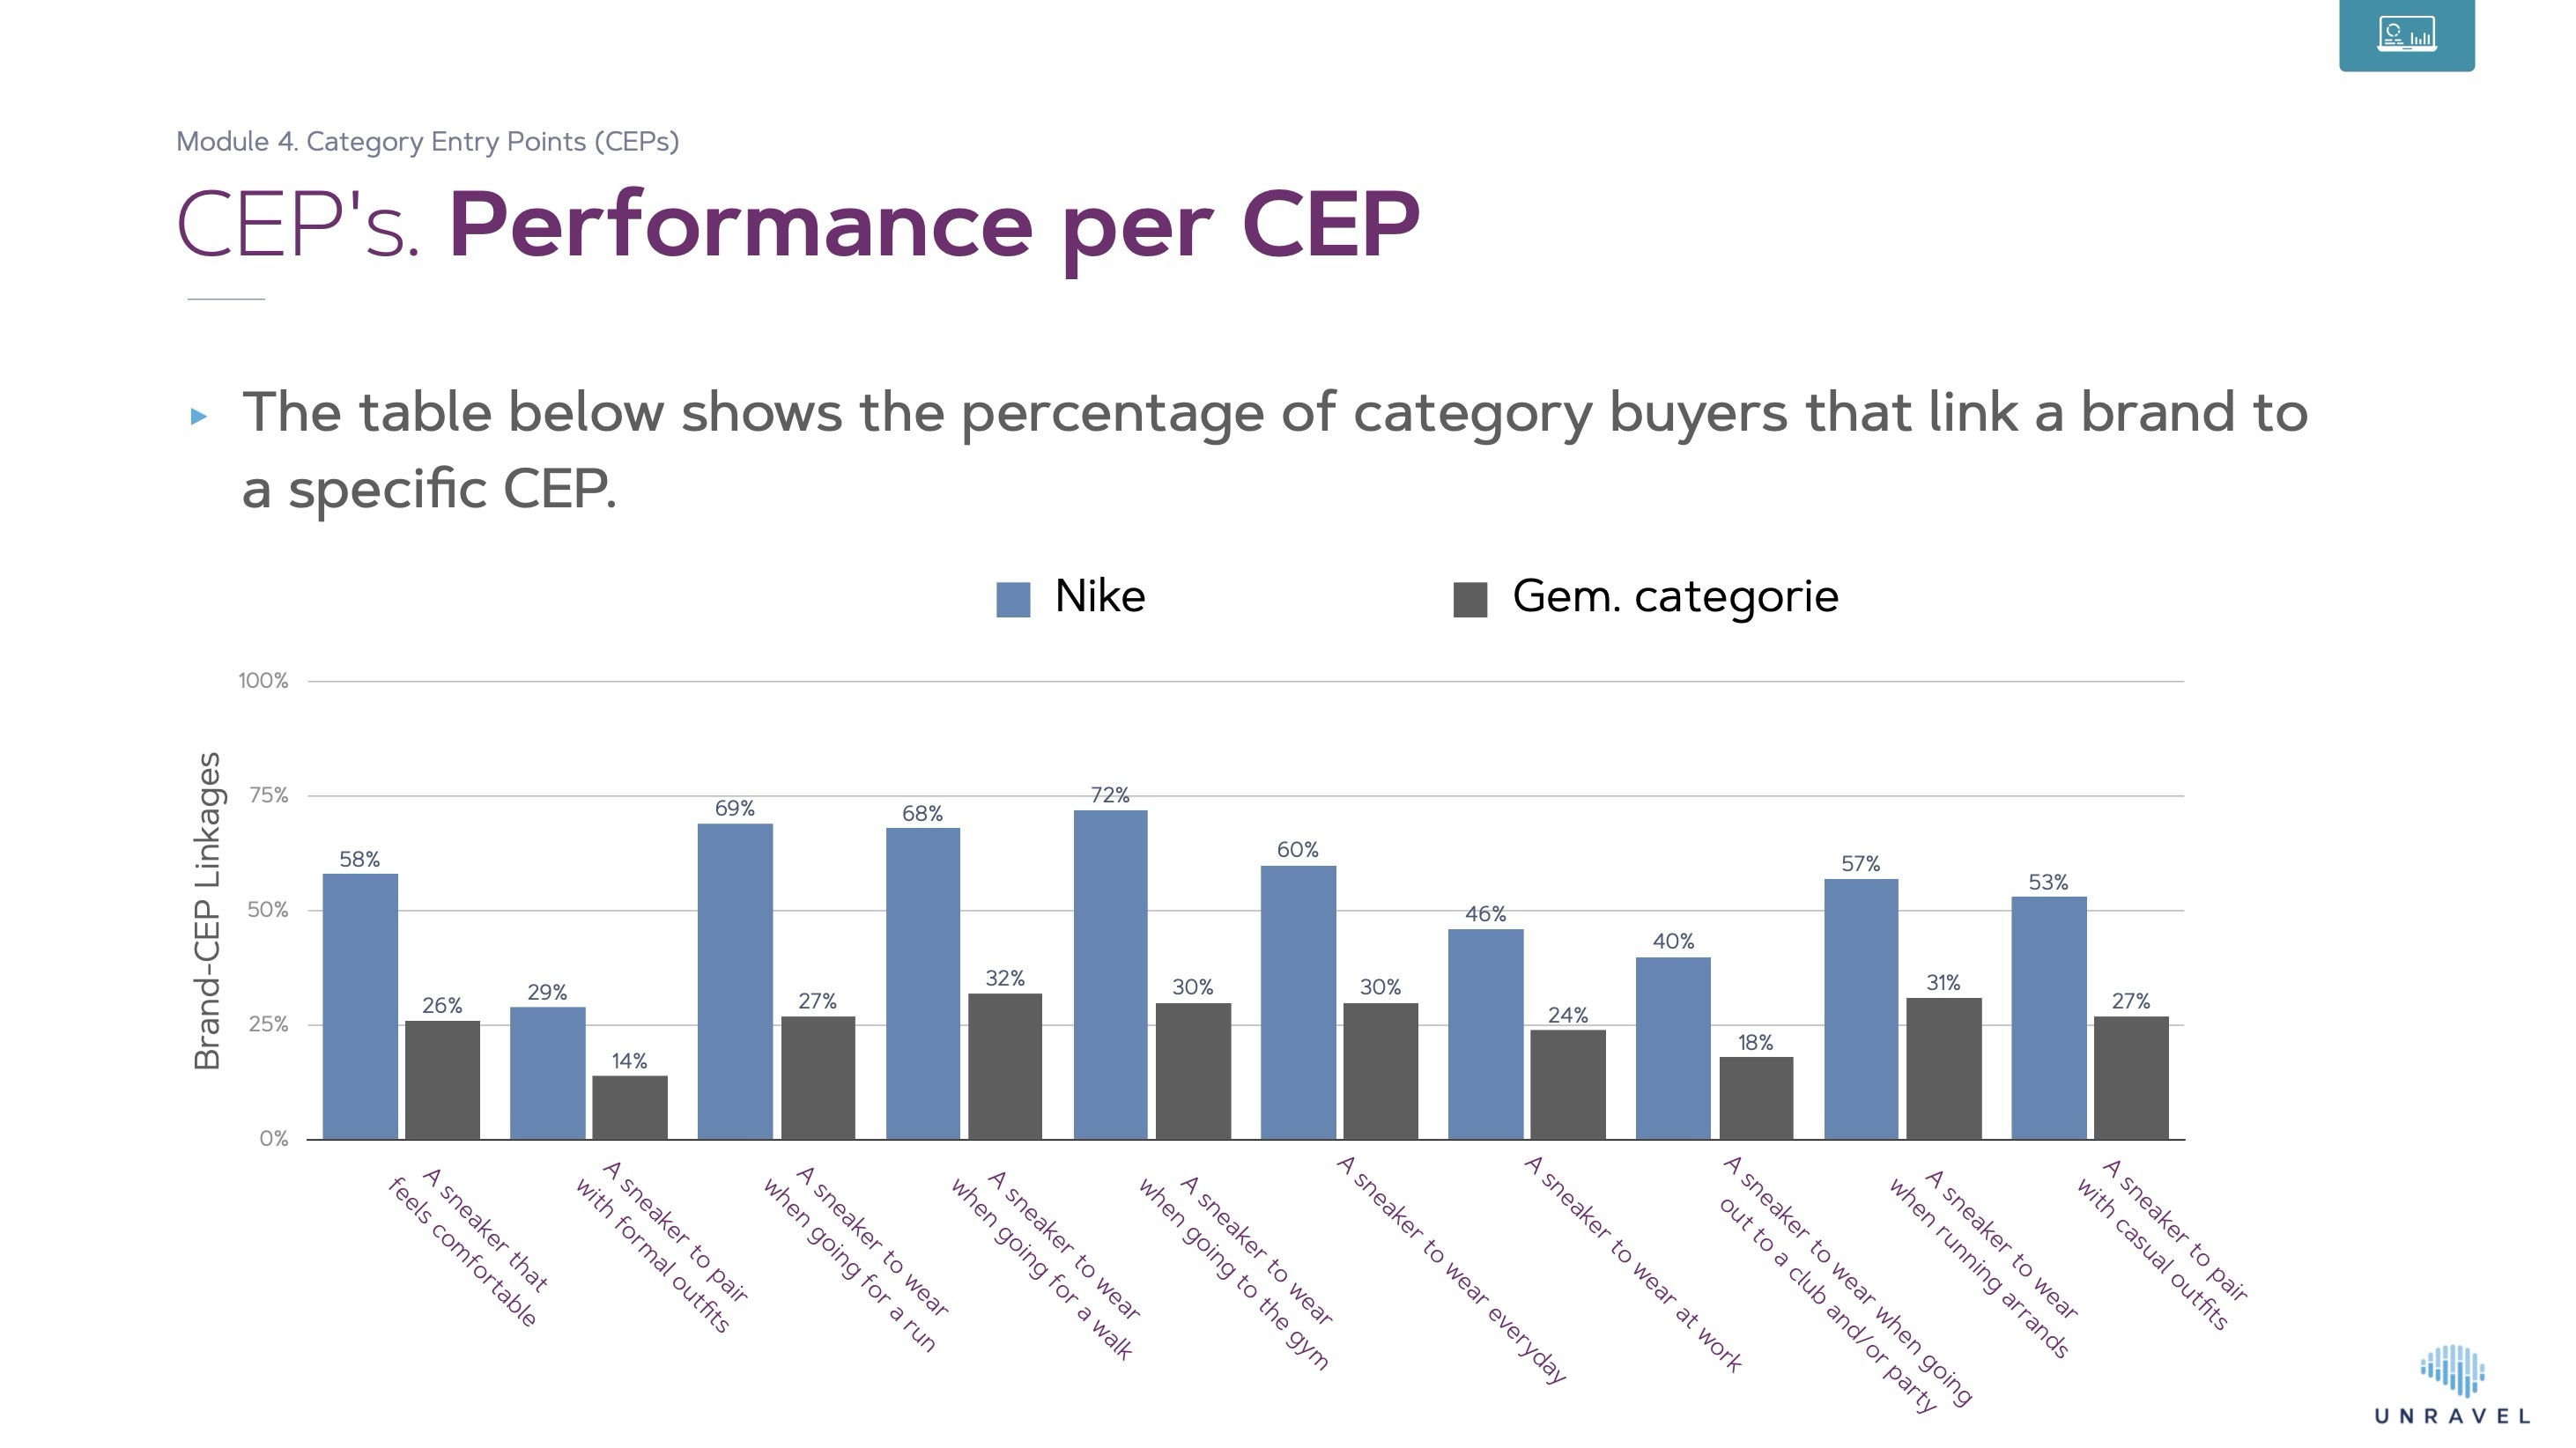
Example Output
Below, find some example output of Category Entry Point (CEP) Measurement. Example include both aggregated performance metrics (mental market share) as well as CEP-level brand linkage.
Page 1
Page 3
Curious what a complete report looks like? As the reports for our clients are confidential we made an example report.
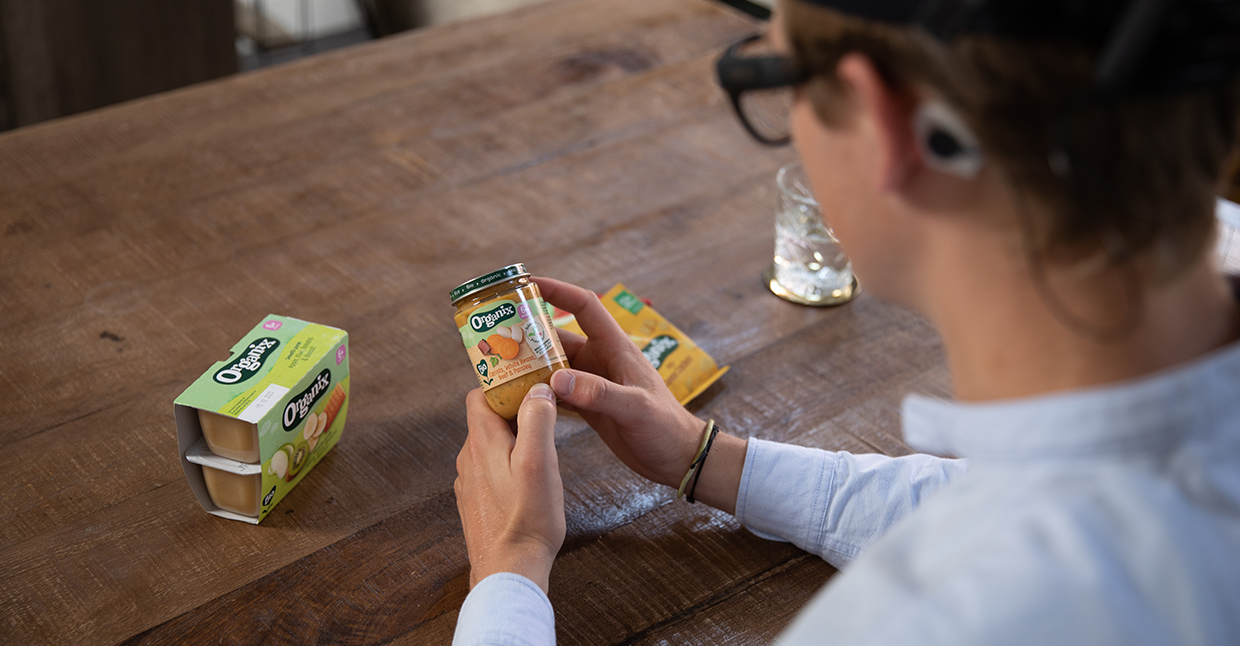
A Category Entry Point is a real-world buying trigger. This can refer to a moment, situation, place or need that sparks someone to think about a product category.
Examples:
“It’s game day” → beer
“I’m stressed” → chocolate
“I have a long drive ahead” → coffee
CEP measurement pinpoints which of these buying triggers your brand owns, and which ones your competitors own instead. The more mental hooks your brand has, the more often it will thought of and bought in purchase situations.
Which metrics are measured in brand asset research? Are they validated?
Because brand image alone doesn’t drive growth; being remembered at the right time does.
Most people don’t shop with your brand top-of-mind all day. They make buying decisions in seconds, based on the first brand they recall when a need arises. CEP measurement focuses on when your brand gets remembered, which is a far stronger predictor of sales than perception and brand imago surveys alone.
The empirical relationship between CEP network size and brand growth is outlined in Byron Sharp's work (How Brands Grow) and Jenni Romaniuk's Better Brand Health.
How does this tie to revenue growth?
It’s simple: more CEPs equals more sales opportunities.
We measure three metrics:
Mental Market Share
Network Size
Mental Penetration
that have a proven link to future sales growth. If you grow these numbers, you grow your market share. And because you learn exactly which CEP's your brand does and doesn't own, you have a clear direction for future brand growth.
How often should we run CEP measurement?
Most brands start with a one-time pilot to identify the most valuable buying triggers in their category using our 5W framework.
From there, we recommend annual tracking to measure progress, outpace competitors, and keep your brand’s mental availability sharp.
Can the research be customized to our business?
Absolutely. We tailor every study to your category, audience, and market goals. That includes the specific CEPs we measure, competitive benchmarking, and, if you need it, segmentation by region, customer type, or high-value audience.
What will we get at the end of the project?
You’ll get a clear, executive-ready report that includes:
A CEP map showing where you lead, lag, and have white space opportunities
Competitive benchmarks to see exactly where you stand
Priority actions to grow mental availability
What sample size do we need, and who should the respondents be?
For a CEP pilot, we recommend 50-100 respondents, all of whom are category buyers, oftentimes defined as people who have purchased from the category within the past 6–12 months (depending on category). This ensures the results reflect real purchase behavior.
For ongoing tracking, 200 category buyers per cell is typical. Everyone answers about every brand, which keeps results consistent and maximizes comparability across the competitive set. In case you want to slice data across segments and behaviors, the number of respondents will increase.
Can we integrate CEP measurement with our existing brand tracking?
Yes. Many clients fold CEP testing into their brand health, ad tracking, or brand asset studies. Unravel's complete Brain-Based Brand Tracker combines these solutions in a single brand tracker.
Alternatively, we can run it as a stand-alone study or plug directly into your existing brand tracker by integrating the survey and passing along the respondent ID.
When setting up a shelf, you want every product segment to be in the right place. However, how is this determined? There is little point in asking questions: a shelf layout must intuitively match the customer's lightning-fast search and choice processes.
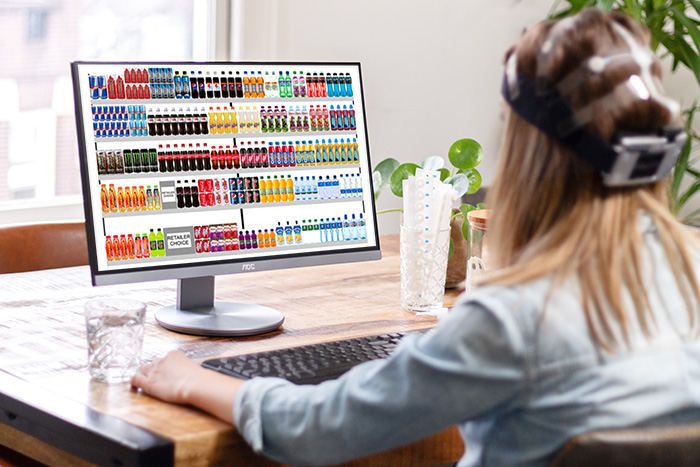
A Neuro Shelf Test with Eye Tracking and EEG helps you test different shelf variants on the success metrics that really matter: ease of search and purchase activation. This way, you can predict exactly which layout is the most brain-friendly and sales-enhancing.
Why a brain-friendly shelf is crucial for the retailer, the brands and the shopper
In each domain, the customer walks in with numerous conscious and unconscious expectations of how products are classified. The better a shelf matches these intuitions in our brain, the more success the entire category achieves. This is due to the psychological effect of fluency: the easier something is to process, the more we like it. Within a store, this positive fluency effect leads to happier customers and fuller shopping baskets. Thus everyone wins!
Test the shelf factors that matter
The more a shelf reflects the mental categories of a customer's mind, the more brain-friendly it becomes. With our Neuro Shelf Test, we can test the influence of many factors, such as:
Position of product segments relative to each other
"Very nice to see how this eye tracking research works. Impressed how well it is arranged and what team you have there."
How it works
We are not aware of most of our shelf intuitions, yet they influence how our eyes navigate through the shelf and how we expect the spatial arrangement of the products. These expectations cannot be questioned by traditional market research such as surveys and interviews, because it can only capture a small number of conscious expectations.
Neuromarketing research on the shelf directly measures how the shopper handles a shelf. Eye Tracking data can reveal search intuition and the speed with which the target product can be found. EEG also provides insights into the cognitive workload and buying activation in the brain.
Compare shelf variants
In a Neuro Shelf Test, we test the effectiveness of multiple shelf layouts. For each variant, we also test two characteristic forms of shelf interaction:
Targeted search (find a specific brand, segment, or purpose of use)
Free choice (look around freely and choose a product you like)
This allows us to measure the performance of targeted and free searches for each shelf variant. The optimal shelf layout scores are high on both forms of interaction.
Success factors
With Eye Tracking and EEG we gain insight into crucial factors that reveal a lot about the effectiveness of a shelf layout:
Speed of finding the target product (Eye Tracking)
Number of people finding target product (Eye Tracking)
Overall Search and ease of choice (EEG)
Overall purchase activation (EEG)
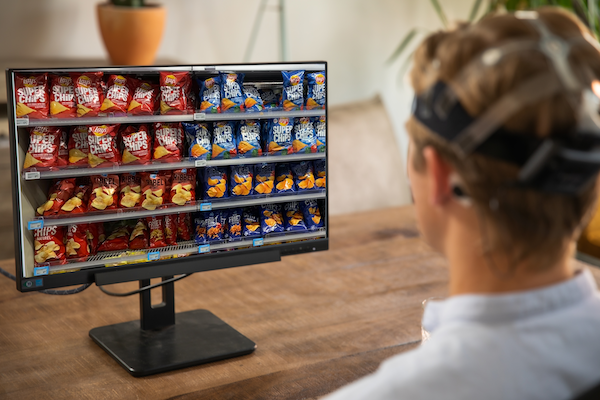
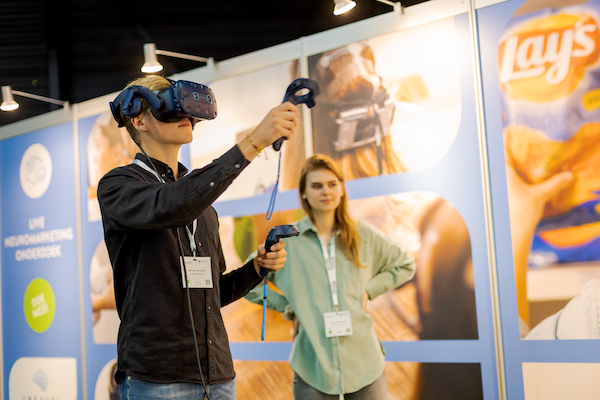
Interaction: Screen or Virtual Reality
Neuro shelf tests are possible by employing 2D shelf presentations on a screen or a completely 3D-developed retail environment in Unravel's Virtual Reality Supermarket.
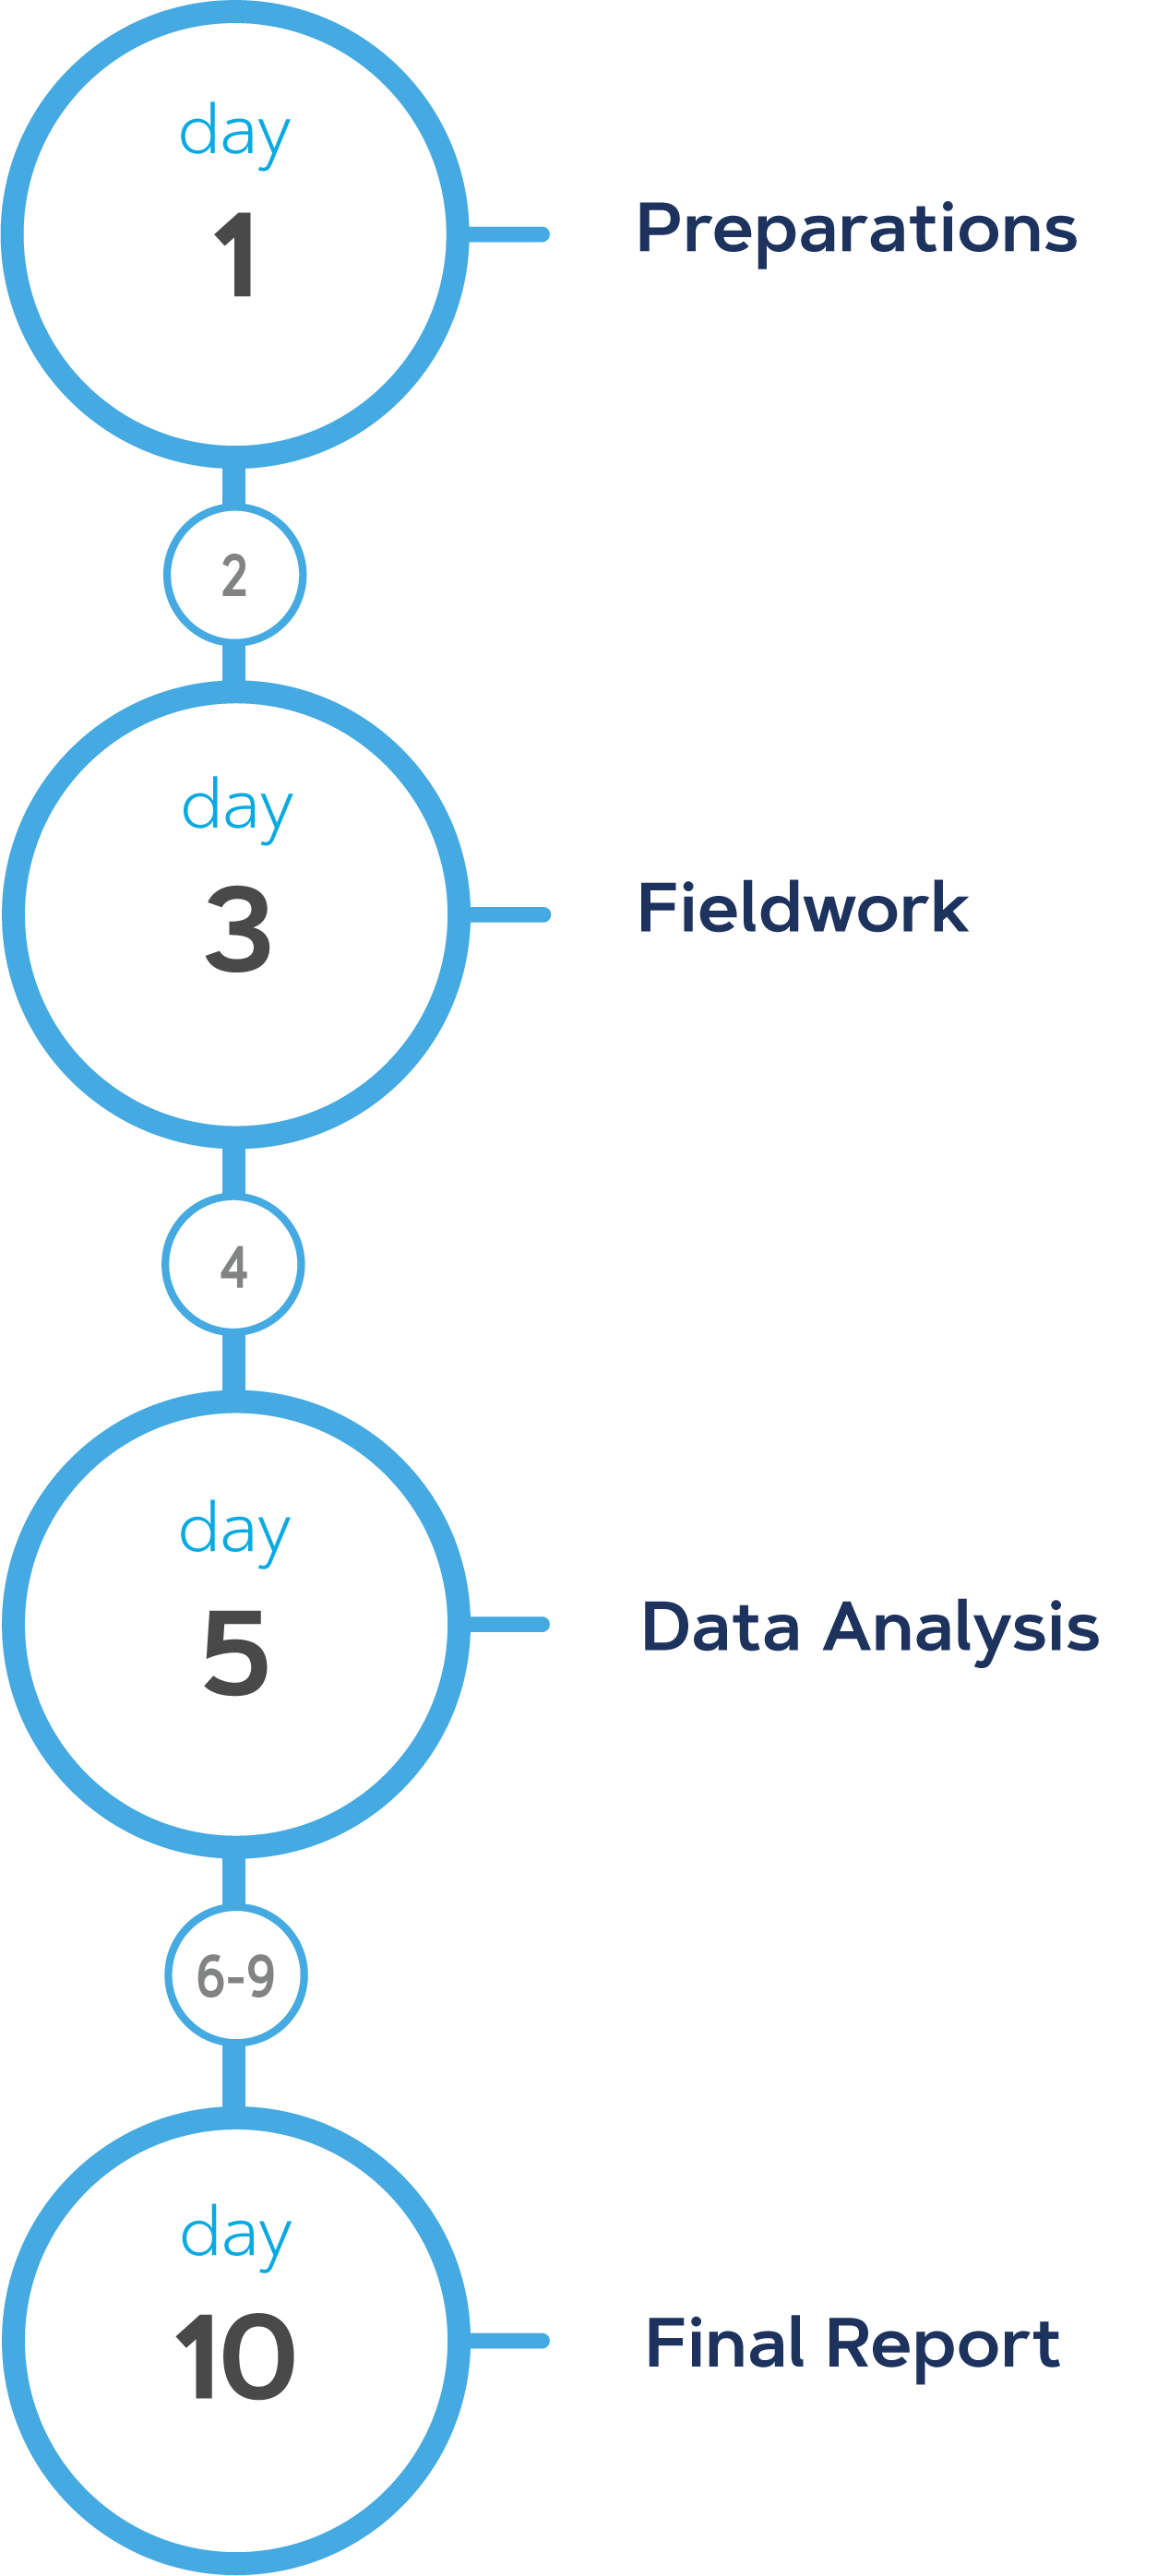
Unravel carries out the neuromarketing shelf and choice research according to a proven approach so that you benefit from a fast timeline. This enables us to offer unparalleled project lead times of 10 working days.
Day 1-2: Kick-off & preparation
In the first week, it is determined in consultation with the client which shelf hypotheses will be tested and which stimuli are necessary. The client provides stimuli (2D images). Based on these criteria a test panel will be recruited and the research will be prepared.
Day 3-5: Field work
During the days of fieldwork, 20-30 respondents visit the living room lab in Utrecht. Here, they are fitted with the Eye Tracker and EEG equipment, after which they are allowed to make free and targeted choices for each shelf variant.
Day 6-10: Data analysis and report writing
For each shelf, we calculate the neuro performance metrics (viewing time, viewing ratio, workload and purchase activation), subdivided into free and targeted search.
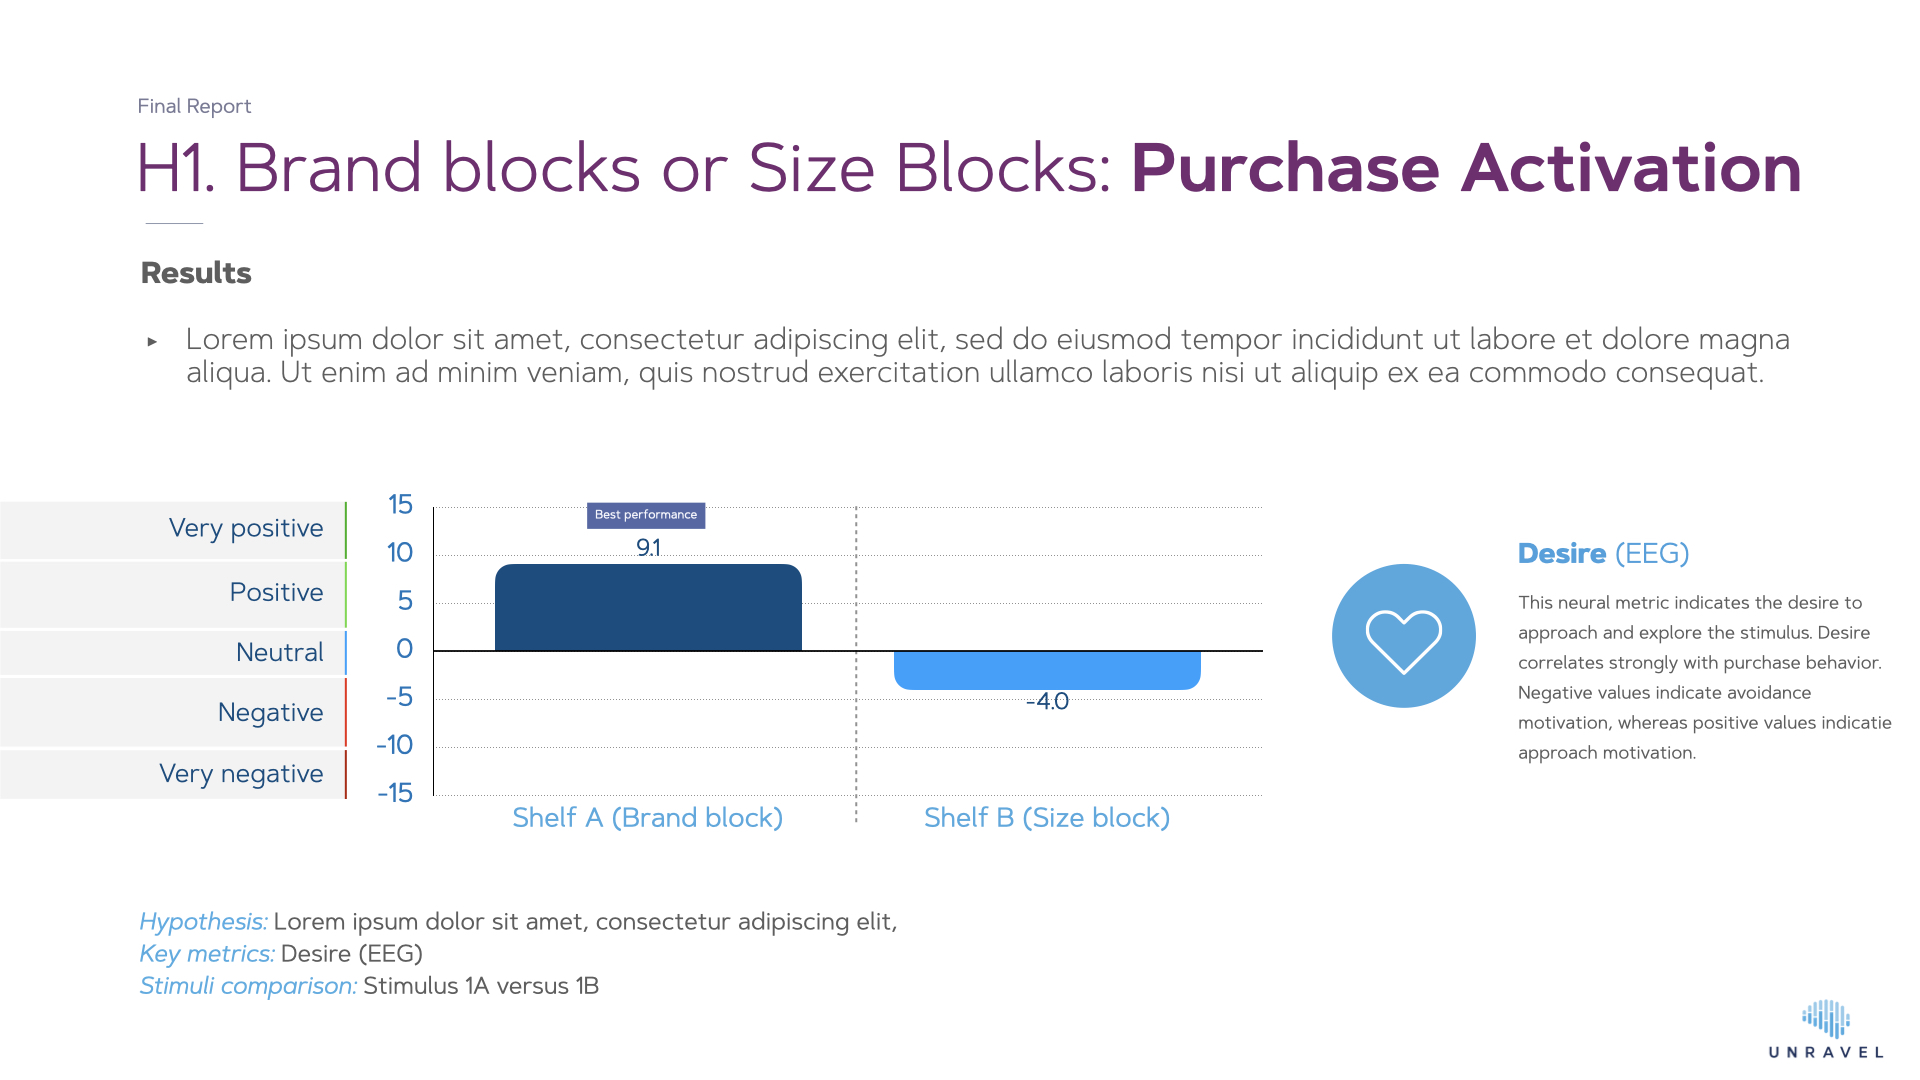
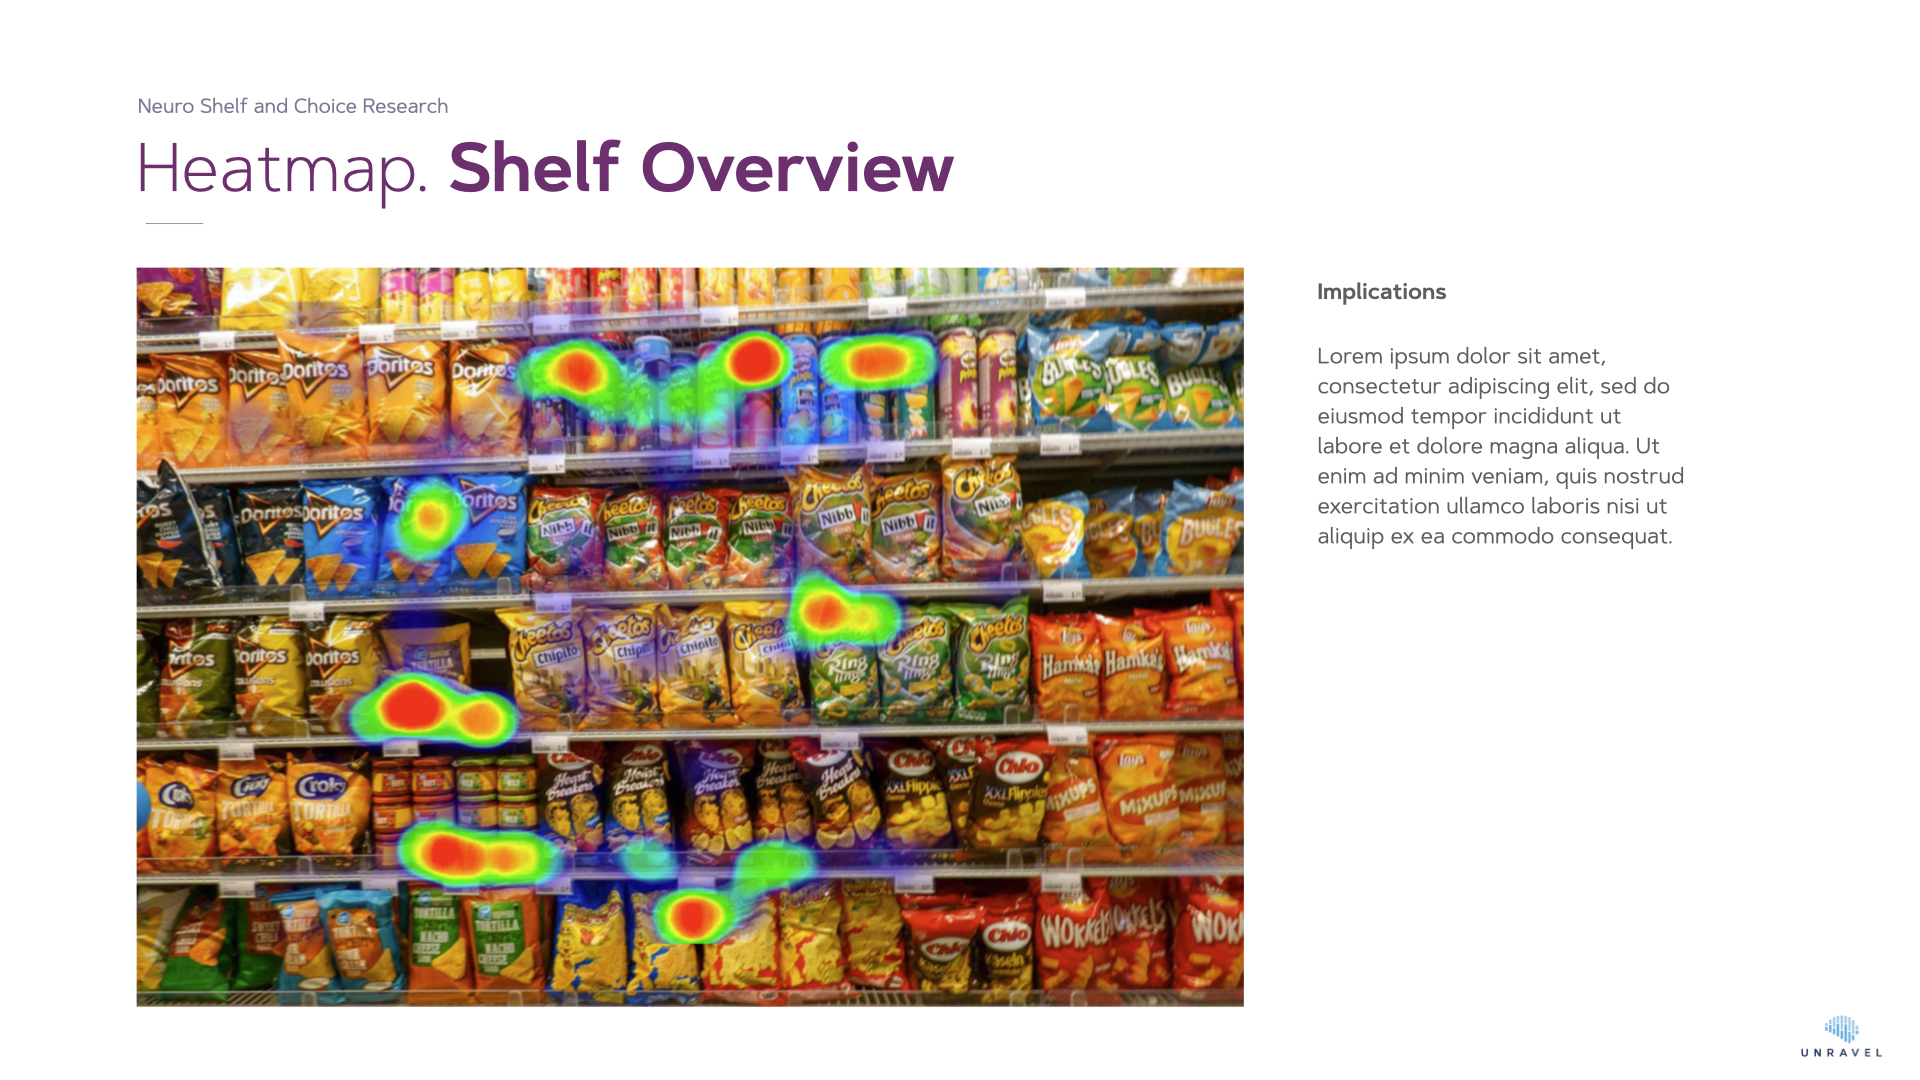
Below you will find an example output of a shelf test. The data is converted into conclusions about ease of search (left), purchase activation (centre) and visual heatmaps of attention (right).
In the simplest research design, we test two shelves, making it an A/B test. However, we often test different hypotheses, so that we gain as much knowledge as possible from a single study in order to optimize the category.
Point-of-sale materials are typically used to promote in-store sales by bringing products to the attention of shoppers. POS materials such as top cards, posters, wobblers, banners, floor stickers or displays can be very effective as the majority of shoppers' purchasing decisions are made in-store. At the same time, it is often difficult to grab the attention of shoppers, because they are often very task-oriented with products.
It is essential that your POS material grabs attention and encourages a purchase. You can not ask this consciously, as shoppers make the majority of their choices unconsciously. However, neuromarketing research with Eye Tracking and EEG makes it possible to measure the attention that your POS material grabs.
Unravel's Neuro Point-of-Sale Test helps you test your POS material against the success metrics that matter, such as attention and purchase activation in the brain. This way, you can know in advance which layout will grab the most attention and increase sales.
Gain insight into (unconscious) viewing behavior
Neuro POS research gives you insight into the amount of attention that your POS expression attracts. Utilizing Eye Tracking we measure exactly where the shopper looks, for how long and in what order. In combination with EEG, brain metrics such as purchase activation and workload can also be measured. That way we can predict the success of your POS communications.
Test multiple expressions and learn what works
In a typical POS study, we test 10-15 different expressions. This way, we can determine which variables in the field of message, design and execution are the most successful. POS material can be examined digitally through screen presentation, or in Unravel's Virtual Reality supermarket environment.
Unlike traditional research, neuromarketing techniques allow you to measure the unconscious response. That is precisely what makes this form of research groundbreaking since the majority of in-store choices are made completely unconsciously.
Discover concrete points for improvement
Whether you test one POS statement individually or multiple statements side by side; POS research yields concrete points for improvement. It gives you insight into whether POS expressions are seen when they are seen during the shopping trip and which elements stand out within the expressions. These insights help you fine-tune future POS campaigns for a more successful outcome.
"We have already done several studies with Unravel. All studies went quickly and smoothly. After each study, we received a short, concise report with recommendations that could be used in practice immediately."
How it works
Neuromarketing research into POS materials directly measures how the shopper processes an expression. Using Eye Tracking, we measure the attentional value of the overall expression, as well as the different parts within the expression (such as headline, copy, visual, etc). EEG also measures cognitive workload and purchase activation in the brain.
Compare POS statements on screen or in Virtual Reality Supermarket
It is possible to test multiple expressions side by side in a Neuro POS test, by using a 2D POS presentation on screen, or in a completely 3D developed retail environment in Unravel's Virtual Reality Supermarket. By comparing POS expressions you gain a complete picture of which techniques work within POS expressions and which do not.
Impact measurement of your campaign: Measure attention in the store
In addition to testing various POS displays in our lab, it is also possible to measure their impact on the physical location itself. We use eye tracking to measure the stopping power of your materials in the store. This research takes place with regular customers, to measure the impact as accurately as possible. If your POS can be found in multiple locations in the store, the data reveals exactly under which circumstances it stands out best.
Unravel Research follows a proven approach so that you can count on reliable results and a fast timeline. This enables us to offer unparalleled project lead times of 10 working days.
Day 1-2: Kick-off & preparation
In the first week, the scope of the project is determined in consultation with the customer. Which parts of the shopping trip do we want to map out, and which purchase order fits in optimally with this? Unravel takes an active advisory role in this because a well-thought-out purchase order is crucial to be able to measure the realistic shopping experience.
Day 3-5: Fieldwork
During the fieldwork days, 20-30 respondents visit the living room lab in Utrecht. Here they are fitted with the Eye Tracker and EEG, after which they are allowed to make free and targeted choices for each shelf variant.
Day 6-10: Data analysis and report writing
We calculate the neuro performance metrics (view time, view rate, workload and purchase activation) for each POS message, subdivided into free and targeted searches. The result? A clear report which offers concrete points for improvement.
Below you will find an example of the output of a Neuro POS Test. On the one hand, the output provides qualitative insights into the POS statement and possible improvements that could be made (left) and, on the other hand, quantitative data are broken down per element within the POS statement.
One of the most important questions in retail research is how a shopper makes choices when standing in front of a shelf. Which product features are considered the most important in the selection process? And what does this imply for the most effective shelf layout?
Shoppers are intuitive and emotional
Traditional marketing research provides limited insights into how customers make their choices. Questioning consumers' choices consciously result in a rational customer decision tree. However, this does not often correspond with the actual choices that consumers make in the store.
Fortunately, in-store research makes use of eye tracking, which makes it possible to measure attention and choice processes of customers directly in a natural shopping environment.
What do customers consider in their buying decisions?
To the millisecond, eye tracking data points out what information is processed by your customer during shopping. In shelf and choice studies, we use this data to determine which product aspects are used to make a choice and whether timing matters here. This provides practical implementations for building an effective shelf layout.
"Very nice to see how this eye tracking research works. Impressed how well it is arranged and what team you have there."
How it works
Classical market research into consumer decision trees attempts to dissect the structure and choice factors of a category by consciously questioning them. However, this completely ignores the emotional and intuitive aspects of choices that are made in front of a shelf.
Neuromarketing research investigates the shelf and choice process by using eye tracking to map exactly how every choice is made.
In-store Eye Tracking
Neuromarketing research into shelf choices takes place in a real shop. Customers are fitted with mobile Eye Tracking glasses, after which they can make purchases in the concerned category according to their preference.
Unravel works with Tobii Glasses 3 Eye Tracking glasses. These are known as the golden standard for in-store eye tracking research. They are accurate, lightweight and indistinguishable from normal glasses for fellow customers. This way, we ensure an extremely realistic selection process.
From raw Eye Tracking data to choice factors
Based on the raw data, we can classify each fixation and product comparison. Based on this, we gain insight into the most dominant choice factors, as well as the position of this factor within the choice process (sooner or later). You gain insight into the role of factors such as:
Taste
Color
Brand
Size
Packaging type
Product name
Claims
Health information
Promotions
etc
Each factor is displayed in a choice grid. On the y-axis, we show dominance (% of customers using this choice factor) and on the x-axis timing (early or late in the choice process). This grid offers a solid basis for shelf layout: it is often effective to divide the shelf based on factors that many people use early in the selection process.
Unravel Research takes a well-tried approach so you can foresee reliable results and a fast timeline. This enables us to offer unparalleled project lead times of 10 working days.
Day 1-2: Kick-off & preparation
In the first week, the products, the choice factors that will be measured and the desired target group of respondents are determined in consultation with the customer. A test panel is then recruited and the respondent instruction will be prepared.
Day 3-5: Field work
During the days of field work, 30 respondents (per sub-target group) visit the physical store. Here they are fitted with the Eye Tracker, after which they are allowed to make several purchases in the concerned category. The research environment is comfortable and realistic so we guarantee the most natural data possible.
Day 6-10: Data analysis and report writing
The data of each respondent is processed from fixation to fixation into a database containing all fixations and comparisons. In this way we can perform numerous analyzes investigating the dominance and order of choice factors, as well as cluster analyzes of which factors are often used collectively.
Below you will find an example of the output of in-store neuromarketing research into shelf and choice processes. The data provides a complete overview of shelf factors (left), hypothesis tests (middle) and a heat map of the shelf (right).
Is it possible to an in-store study with different target groups?
Yes, it is possible to conduct an in-store survey with different target groups, so that you can measure differences between these groups. It is necessary to increase the sample size in order to make a fair comparison. We recommend using 30 respondents per sub-target group.
What are the benefits of in-store neuromarketing research?
Just like classic research into customer decision trees, this neuromarketing approach aims to understand even the most important choice factors within a category. This helps to slim down shelves and thus achieve higher sales. Unlike classic CDT research, eye tracking is able to reveal the intuitive and unconscious choice factors that are leading in the customer's choice process.


 EN
EN  NL
NL